


At BillTrack50 we collect a LOT of data as we track bills. So occasionally we like to crunch the data and produce some charts, just for fun. The chart below shows bill activity over time, looking by month at the overall number of actions on all bills, the number of bills introduced and the number of votes taken.
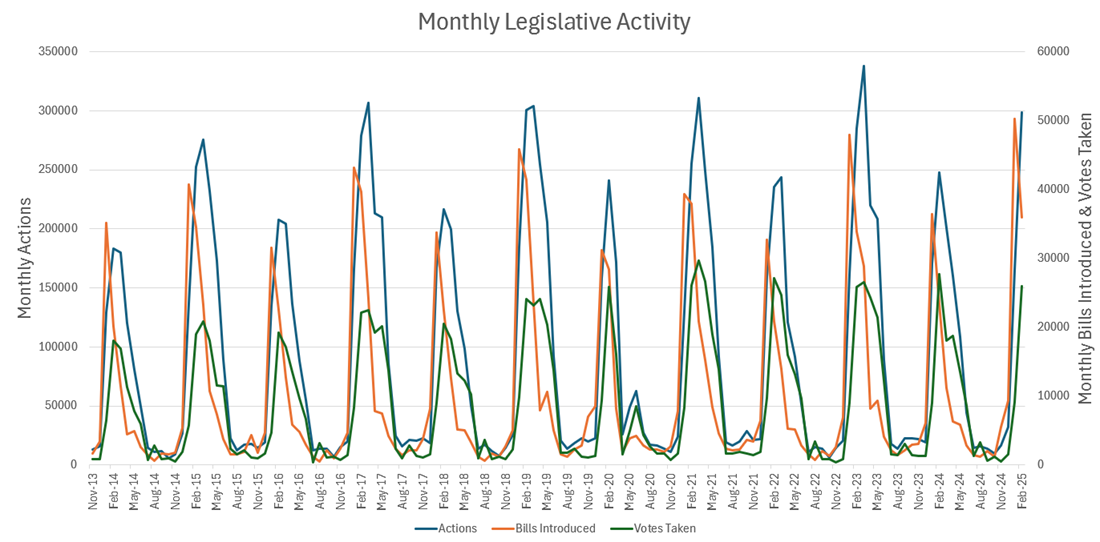
Notes: You can see the introduction of bills start picking up each November as pre-filing starts and peaking in Jan each year, and then actions pick up (actions are any step in the process, assigned to committee, amended, etc), typically peaking in March, followed by voting activity.
The every other year peak in bill count is due to two factors. First, four states only meet in odd years (MT, ND, NV, TX) and some states have an abbreviated even year session. Second, about half the states operate on a biennium basis, so they typically don’t have quite the burst of new bills on the even year (only NJ starts it’s biennium on the even year).
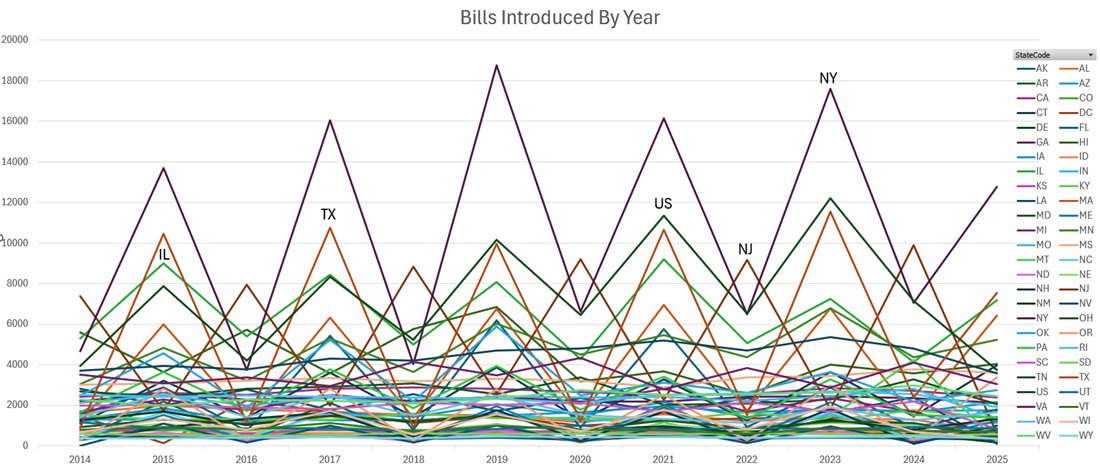
And finally, have you ever wondered which states introduce the most bills? Well wonder no more! The chart below shows that NY is by far the most prolific state when it come to the sheer number of bills introduced. But federal bills have been steadily increasing and now surpass the next busiest state, TX. Note NJ is out of sequence with the other states due to starting on even years.
About BillTrack50 – BillTrack50 offers free tools for citizens to easily research legislators and bills across all 50 states and Congress. BillTrack50 also offers professional tools to help organizations with ongoing legislative and regulatory tracking, as well as easy ways to share information both internally and with the public.